Your brain is one of the most intricate, complex and fascinating elements of the universe. It allows you to remember past events, process all of the present sensory impressions, and project all of your thoughts, memories and estimations into the future.
All of this is done so you can actively search for food, interact with your surroundings, talk with friends and family or evade live-threatening predators – of course, you also have to deal with more complex everyday tasks such as writing up your Ph.D thesis, mastering a job interview … or beating your best friend’s Candy Crush high score.
N.B. this post is an excerpt from our EEG Pocket Guide. You can download your free copy below and get even more insights into the world of EEG.
Free 59-page EEG Guide
For Beginners and Intermediates
- Get a thorough understanding of the essentials
- Valuable EEG research insight
- Learn how to take your research to the next level

Table of Contents
Your brain is “on” 24/7
No matter whether you’re asleep or awake, preparing the next business meeting, or taking a leisure stroll around town – as you think, dream, see and sense, your brain is constantly active.
It absorbs all information, compacts and re-wires existing data, and integrates everything into a consistent experience, both of yourself and of your surroundings. For you, that experience constitutes your reality. Your brain shapes how you see your environment, – it filters and highlights the objects and information most relevant to you. Based on your thoughts, emotions, desires and experiences, your brain ultimately drives your behavior. It even controls behavioral processes without you even noticing.
The building blocks of the brain
Obviously, analyzing behavior and its underlying drivers requires a thorough understanding of the complexities of the human brain, both in structure and in function. To put it differently: What are the building blocks of the brain and how do they interact?
Thanks to recent progress in imaging techniques, processor technologies, data analysis procedures and algorithms, both academic and commercial researchers are able to dive into the depths of the human brain and see how it shapes our perceptions and interactions with the world.
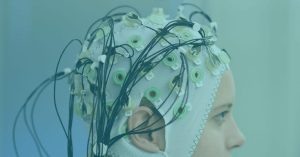
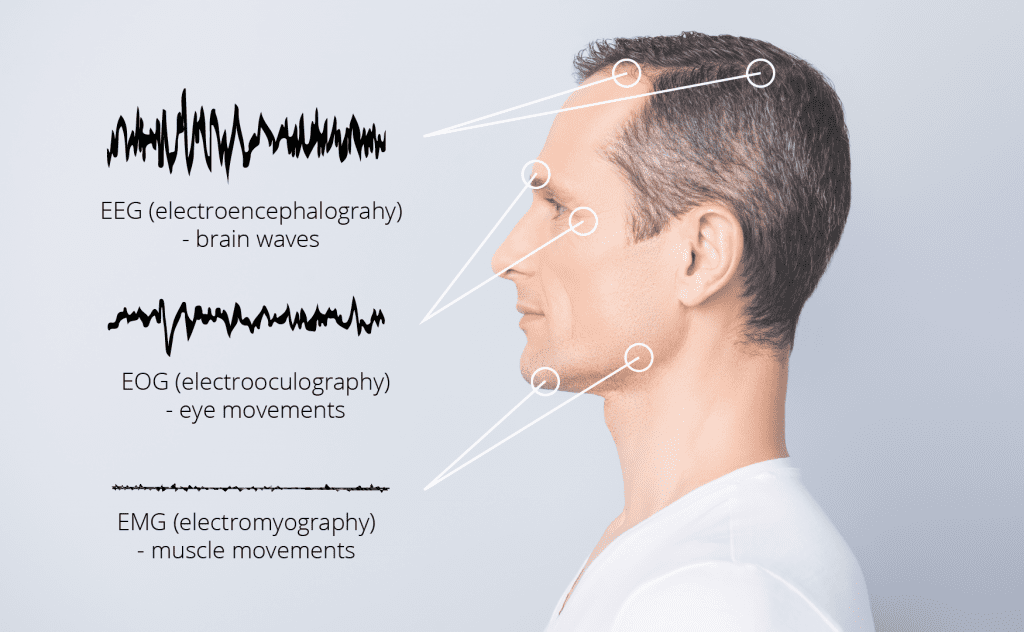
One of the most versatile brain imaging techniques is electroencephalography. In short: EEG. Literally, electro-encephalo-graphy means writing of the electric activity of the brain. Why writing? Similar to a seismometer, EEG recordings were initially done on paper.
Electroencephalography records the electrical activity of the brain using electrodes placed on the scalp. Measuring electrical activity from the brain is useful because it reflects how the many different neurons in the brain network communicate with each other via electrical impulses.
Why is EEG an exceptional Tool for Human Behavior
There are several reasons why EEG is an exceptional tool for studying the neurocognitive processes underlying human behavior (Cohen, 2011):
- EEG has very high time resolution and captures cognitive processes in the time frame in which cognition occurs. Cognitive, perceptual, linguistic, emotional and motor processes are fast. Most cognitive processes occur within tens to hundreds of milliseconds – much faster than the blink of an eye. In addition, the events triggering cognitive processes occur in time sequences that span hundreds of milliseconds to a few seconds. Similar to a high-speed camera, EEG has a high time resolution and can capture the physiological changes underlying the cognitive processes much better than other brain imaging techniques (such as MRI or PET scanners).
- EEG directly measures neural activity. Your brain is constantly active, generating electrical activity which of course is very subtle (significantly less than a 9V battery) but detectable with the right device. EEG sensors are able to pick up these tiny signals from the scalp surface. Neuroscientific research has been obtaining consistent findings and established well-accepted theories on how the EEG signals relate to cognitive, affective or attentional processing. On the other hand, while techniques like MRI have a great spatial resolution, they essentially measure neural activity indirectly and require a much deeper understanding of the relationship between what is measured and how it relates to cognitive processing.
- EEG is inexpensive, lightweight, and portable. Have you ever tried to run a study in the wild with an MRI scanner? It’s simply not possible. In contrast, EEG systems are portable, lightweight and therefore allow for flexible data collection in real-world environments.
- EEG monitors cognitive-affective processing in absence of behavioral responses. Brain processes ultimately drive behavior. However, if you’re interested in mental processes such as response inhibition, creativity or meditation, the behavioral effects might be very subtle. By contrast, these processes are ideal candidates for EEG as they are accompanied by distinguishable electrical brain activation patterns.
With EEG, you can obtain insights into how the brain works, which brain areas are active, and how they interact. But how exactly are these signals generated?
Check out: What is EEG and How does it Work
fBrain regions and their functions
The human brain is the main organ of the human central nervous system (CNS).
On average, it weighs about 1.4 kg (approximately 2% of total body weight) and shares many properties with other vertebrate brains, including a basic division into different regions.
Say hello to the brainstem, limbic system, the cerebellum and the cerebrum:
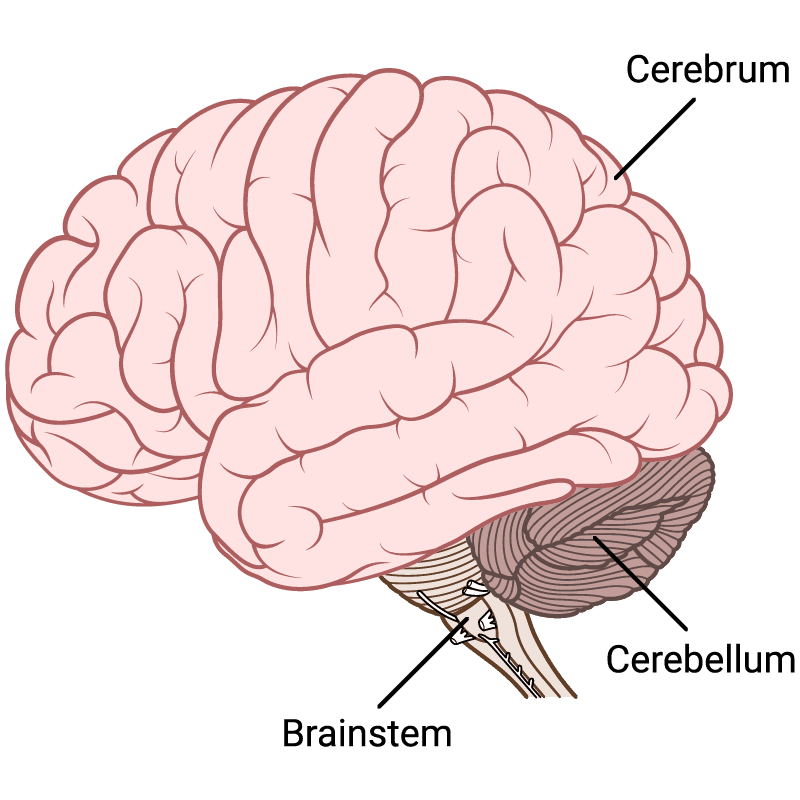
1. The Cerebrum
The Cerebrum or cortex is the forward-most portion and largest part of the human brain. It is generally associated with higher brain functions such as conscious thought, and sensory processing. The cerebrum consists of two hemispheres which are connected through a mass of nerve cells making up the corpus callosum. The cerebral cortex has a highly convoluted topography of sulci (furrows) and gyri (ridges). If you could spread out all of these furrows and ridges, you would get a total cerebral brain surface area of about 2500 cm² – about the size of a 50 x 50 cm pillow case (Peters & Jones, 1984).
2. The Cerebellum
The Cerebellum (meaning “little brain“) has two hemispheres which have highly folded surfaces. The cerebellum contributes to regulation and control of fine movements, posture and balance. It receives input from sensory systems of the spinal cord and from other brain areas and integrates these inputs to fine-tune motor activity.
3. The Brainstem
The Brain Stem is the lower and oldest part of the brain, comprising the midbrain, pons and medulla. Often called the reptilian brain, it controls autonomic body processes such as heartbeat, breathing, bladder function and sense of equilibrium.
Basically, the brain stem controls everything that you want to automatically work without having to consciously think about.
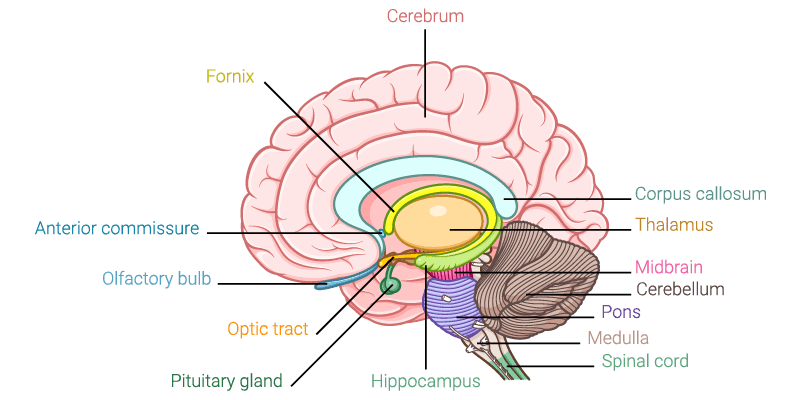
4. The Limbic System
The Limbic System is often referred to as the emotional brain. It is buried deep within the brain and constitutes an evolutionarily old structure. The limbic system includes the thalamus, hypothalamus and amygdala. The limbic system plays a central role in arousing fight-or-flight situations, such as job interviews, Black Friday shopping trips or dates with your future partner.
The cerebral cortex is further divided into four sections, the lobes. While there are right and left counterparts for each lobe, there’s subtle differences between the hemispheres.
Within the popular imagination, the right hemisphere is associated with creativity and imagination, while the left hemisphere is associated with logical abilities such as numerical and spatial cognition. However, this association is phasing out as scientific research is coming up with more intricate imaging technologies and analysis techniques, which allow for deeper insights than ever before. Differences do exist between the hemispheres, but they are more complex than the previous picture paints.
A basic division is still made between 4 lobes: Occipital, temporal, parietal, and frontal.
5. The Occipital Lobe
The Occipital lobe is the visual processing center of our brain, including low-level visuospatial processing (orientation, spatial frequency), color differentiation and motion perception. Occipital cortex is located in the rearmost portion of the skull. All the things that we see are processed here (although some processing does also occur before and after the signal arrives to the occipital cortex, this region is central to visual processing and perception). Occipital lesions are typically associated with visual hallucinations, color or movement agnosia as well as blindness.
6. The Temporal Lobe
The Temporal lobe is associated with processing sensory input to derived, or higher, meanings using visual memories, language and emotional association. The temporal cortex is responsible for long-term memory. The left temporal cortex is involved in the comprehension of written and spoken language (Wernicke’s area). Damage to these regions causes deficits in talking (Wernicke’s aphasia). There even exists a rare foreign accent syndrome caused by left temporal lesions – affected patients sound as though they speak their native languages with a foreign accent.
7. The Parietal Lobe
The Parietal lobe is all about integrating information stemming from external sources as well as internal sensory feedback from skeletal muscles, limbs, head, eyes, otoliths etc. Parietal cortex is responsible for merging all of these information sources into a coherent representation of how our body relates to the environment, and how all things (objects, people) in the environment spatially relate to us. Tasks requiring eye or hand movements as well as eye-hand coordination would be impossible without parietal cortex, which also processes, stores and retrieves the shape, size and orientation of objects to be grasped.
Further, parietal areas seem to be relevant for self-referential processing and feelings of agency. Damage in parietal cortex has been found to cause severe disruptions in motor behavior and object-oriented actions as well as out-of-body experiences.
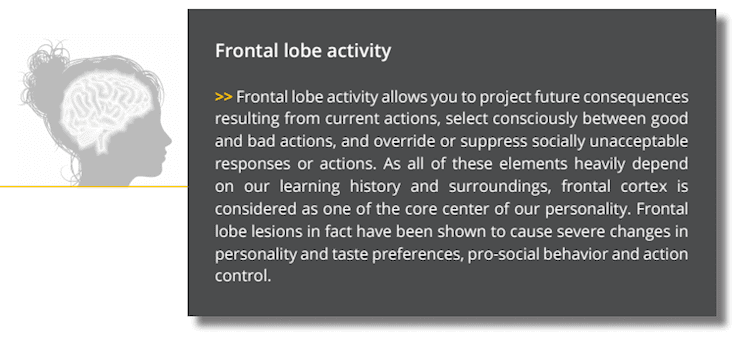
8. The Frontal Lobe
The Frontal lobe is the region where most of your conscious thoughts and decisions are made. Also, frontal cortex contains motor areas where voluntary movements of all of our limbs and eyes are controlled. The frontal lobe contains most of the dopamine-sensitive neurons. This is highly relevant to be aware of since the dopamine system is responsible for any cognitive processing associated with reward, attention, short-term memory, planning and motivation.
Neural activation and electrical fields
There are about 85 billion neurons in the human brain – these are the cells that carry out the vast majority of communication in the brain. There are also billions of other cells that carry out a range of functions to both support, nurture, and facilitate neural signaling (among other functions)
Neurons typically consist of a cell body and one or more axons which all end at synapses. Synapses act as gateways of inhibitory or excitatory activity between neurons. This means that synapses propagate (“fires”) information impulses across neurons that either increases the chance of the subsequent neuron signaling (excitatory) or decreases the chance of the subsequent neuron signaling (inhibitory).
Synaptic transmission triggers the release of neurotransmitters (dopamine, epinephrine, acetylcholine, etc), which can cause a voltage change across the cell membrane. Synaptic activity often generates a subtle electrical field, which is also called a postsynaptic potential (post = behind). Postsynaptic potentials typically last tens to hundreds of milliseconds.
The postsynaptic potential of a single neuron is too tiny to even be noticed. However, whenever the voltage change associated with a postsynaptic potential occurs for a smaller group of neurons (about 1000 or more), the resulting electrical field becomes much stronger. Think of this as a constant rumble of subtle earthquakes.
Taken by itself, each burst might be too small to be recorded, Yet, if there’s several of them happening at the same time, in the same location, and in the same rhythm, they all add up to a mega-quake that will be noticeable even thousands of miles away. In case of the human brain, of course the dimensions are much smaller.
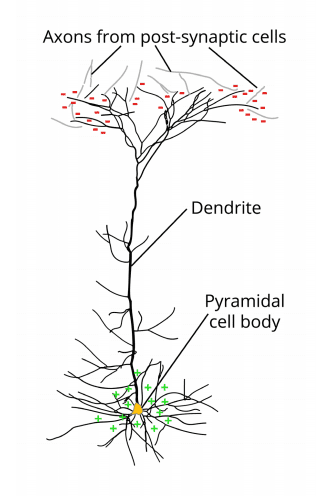
On fire: Pyramidal cells
Not all electrical fields generated by the brain are strong enough to spread all the way through tissue, bone and skull towards the scalp surface. Research indicates that it is primarily the synchronized activity of pyramidal neurons in cortical brain regions which can be measured from the outside (i.e. from EEG devices). Their name stems from the pyramidal/triangular shape of their cell body.
Pyramidal cells can be found in all cortical areas (occipital, temporal, parietal, frontal cortices), where they are always oriented perpendicular to the cortical surface. The cell body is heading away from the surface (towards the grey matter), while their dendrite is heading towards the surface (for more details see Luck, 2014 and Buzsáki et al., 2012).
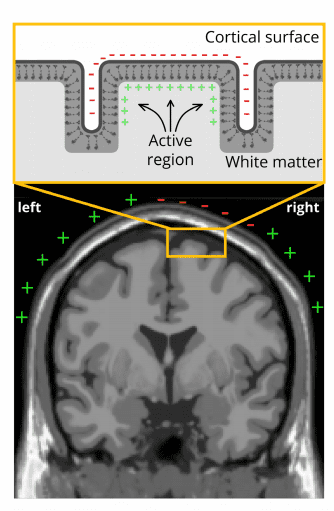
This unique orientation of the cells generates an electrical field with a very stable orientation. By contrast, cells in deeper brain structures (such as the brain stem or cerebellum) don’t have this specific orientation.
As a result, the electrical fields are more likely to spread into various directions and cancel out instead of projecting in a stable way towards the scalp surface – even if hundreds of thousands of neurons in these deeper regions show synchronized activity.
EEG signals
To record electrical activity generated by the brain, EEG researchers don’t have to open skulls to place sensors (although that does happen too). Thankfully, it can be much easier than that – they simply record the electrical data from sensors (electrodes) placed at the scalp surface. First applied to humans in the 1920s by German neurologist Hans Berger (Jung & Berger, 1979), EEG is an inexpensive, non-invasive, and completely passive recording technique.
EEG has several benefits compared to other imaging techniques or pure behavioral observations. The most central benefit of EEG is its excellent time resolution, that is, it can take hundreds to thousands of snapshots of electrical activity from multiple electrodes within a single second. This renders EEG an ideal technology to study the precise time-course of cognitive and emotional processing underlying behavior.
In contrast to other physiological recordings (such as EDA/GSR) which often require only a couple of electrodes, EEG recordings are done with electrode arrays, comprising various sensor numbers ranging from 10 to 500+ electrodes, depending on the scope of the experiment. For faster application, EEG electrodes are mounted in elastic caps, meshes, or rigid grids, ensuring that the data can be collected from identical scalp positions across sessions or respondents.
Since the electrical signals are very small, the recorded data is digitized and sent to an amplifier. Price differences in EEG systems are typically due to the number and quality of the electrodes, the quality of the digitization as well as the quality and sampling rate of the amplifier. Usually, EEG systems with higher sampling rates are more expensive than devices with lower sampling rates.
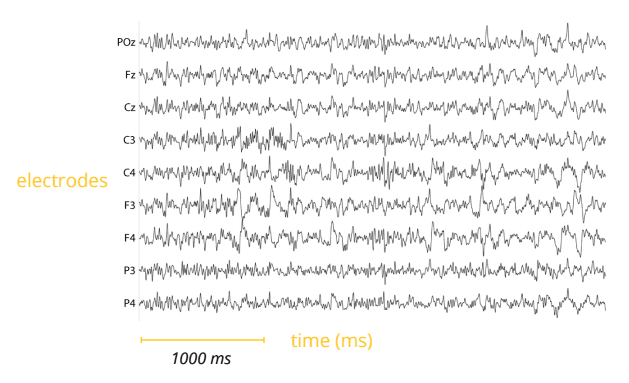
Once the data is amplified, it can be displayed as a time series of voltage values. 100 years ago the EEG time course was plotted on paper. While EEG recordings in clinical environments are sometimes still paper-based, almost all EEG systems in academic and commercial research show the data as continuous flow of voltages on a computer screen.
EEG compared to other brain imaging techniques:
- Magnetoencephalography (MEG) records the magnetic fields generated by neural activity. Like EEG, MEG has excellent time resolution and is often considered to capture deeper neural activity much better than EEG. MEG scanners are large, stationary and expensive. They require heavy technical maintenance and training resources.
- Functional Magnetic Resonance Imaging (fMRI) measures changes in blood flow which is associated with changes in neural activity. Increased neural firing requires oxygen, which is delivered by blood, and the magnetic properties of oxygenated blood are different from those of non-oxygenated blood. This property is measured by fMRI as a distortion of the magnetic field generated by hydrogen protons. fMRI has excellent spatial resolution while at the same time lacking the time resolution of EEG.
- Positron emission tomography (PET) is a nuclear imaging technique based on gamma radiation caused by decaying radionuclides which are inserted into the body of the respondent. With PET, you can monitor metabolic activity (for example, glucose metabolism) of neurons during cognitive activity. While PET scans are much more robust towards motion artifacts, they are lacking the high time resolution of EEG recordings.
EEG rhythms and oscillations
You have already learned that cortical activity is associated with postsynaptic potentials of neurons. Of course, the postsynaptic potential of a single neuron is too small to be detected. However, if postsynaptic potentials occur at the same time and in synchrony for hundreds of thousands of similarly oriented neurons, they sum up and generate an electric field, which is rapidly propagated throughout brain tissue and skull. Eventually, it can be measured from the scalp.

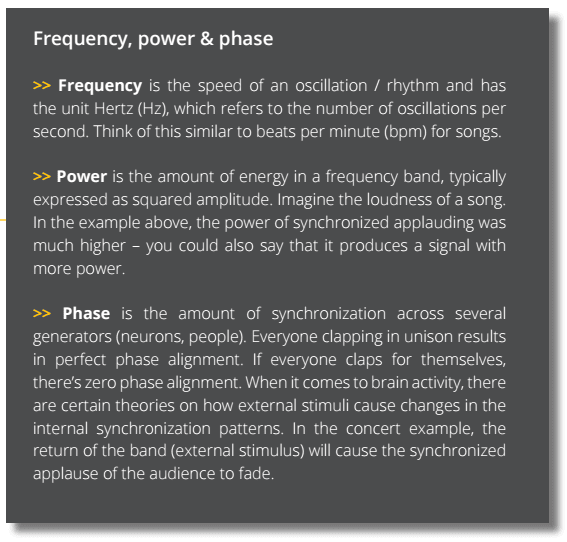
Think of this as an audience applauding. At first everyone claps in their own rhythm, causing white noise without any observable pattern. After a short while, however, the audience gets in sync – all of a sudden everyone is clapping at the same time, in the same rhythm. This synchronized clapping is much louder than the white noise a few minutes ago. At a certain point in time, the synchronization will fade.
Irrespective of whether it’s neural activity, the clapping of a crowd or the rumbling of an earthquake, all of these phenomena occur because of a synchronization of oscillation patterns.
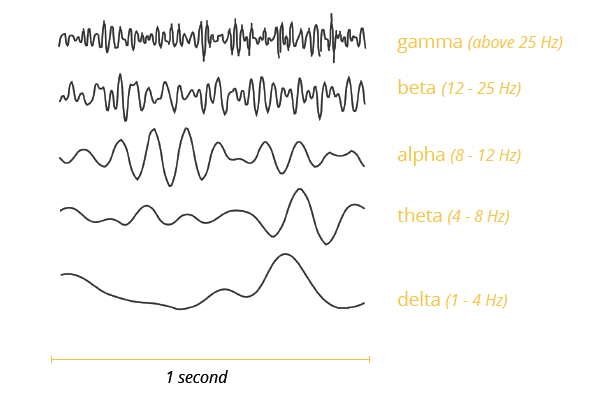
The billions of neurons in the human brain have highly complex firing patterns, mixing in a rather complicated fashion. The neural oscillations that can be measured with EEG are even visible in raw, unprocessed data. However, the signal is always a mixture of several underlying base frequencies, which are considered to reflect certain cognitive, affective or attentional states. Because these frequencies vary slightly dependent on individual factors, stimulus properties and internal states, research classifies these frequencies based on specific frequency ranges, or frequency bands: Delta band (1 – 4 Hz), theta band (4 – 8 Hz), alpha band (8 – 12 Hz), beta band (13 – 25 Hz) and gamma band (> 25 Hz).
EEG Frequency ranges / Frequency Bands
1. Delta band (1 – 4 Hz)
Being the slowest and highest amplitude brainwaves, oscillations in the 1 – 4 Hz range are characterized as delta waves (Niedermeyer & da Silva, 2012). Delta waves are usually only present during deep non-REM sleep (stage 3), also known as slow wave sleep (SWS). In sleep labs, delta band power is examined to assess the depth of sleep. The stronger the delta rhythm, the deeper the sleep. Delta frequencies are stronger in the right brain hemisphere, and the sources of delta are typically localized in the thalamus. Since sleep is associated with memory consolidation, delta frequencies play a core role in the formation and internal arrangement of biographic memory as well as acquired skills and learned information.
Typical studies on delta:
Sleep and sleep disorders. Certain neurological diseases such as Parkinson’s, Dementia or Schizophrenia are often accompanied by sleep disorders. Monitoring EEG during sleep can give insights into the depth of sleep and potential risks associated with sleep disorders.
Alcoholism and sleep. Alcohol has strong side effects on sleep. Heavy drinking decreases slow wave sleep and therefore delta frequencies necessary for memory consolidation – even after long periods of abstinence (for details, see Colrain et al., 2009).
2. Theta band (4 – 8 Hz)
Brain oscillations within the 4 – 8 Hz frequency range are referred to as theta band (Niedermeyer & da Silva, 2012). Studies consistently report frontal theta activity to correlate with the difficulty of mental operations, for example during focused attention and information uptake, processing and learning or during memory recall. Theta frequencies become more prominent with increasing task difficulty. This is why theta is generally associated with brain processes underlying mental workload or working memory (Klimesch, 1996; O‘Keefe & Burgess, 1999; Schack, Klimesch, & Sauseng, 2005).Theta can be recorded from all over cortex, indicating that it is generated by a wide-ranging network involving medial prefrontal areas, central, parietal and medial temporal cortices. Apparently, theta serves as carrier frequency for cognitive processing across brain regions that are further apart (Mizuhara, Wang, Kobayashi, & Yamaguchi, 2004).
Typical studies on theta:
N-back task. In this task, respondents see rapid sequences of letter, number or icon stimuli on screen. At the same time, they have to remember the element N steps back and respond if the element showed certain characteristics (for example, “Was the letter two steps back an M?”). Workload and theta power increases with longer memory spans (for example, for N = 6 compared to N = 2; see Onton, Delorme, & Makeig, 2005 for details.
Spatial navigation. In navigation tasks in real environments or in virtual reality, workload and theta have been found to increase in complex maze systems or at key landmarks along a route (Kahana et al., 1999).
Brain monitoring in operational environments. Theta band activity is generally monitored in vigilance and monitoring tasks, for example in air traffic or vessel control, vehicle steering or obstacle avoidance. Also, theta and workload monitoring is applied in military scenarios where trained observers evaluate satellite footage of combat areas and complex information has to be processed in order to avoid potentially life-threatening situations.
3. Alpha band (8 – 12 Hz)
First discovered by Hans Berger in 1929, alpha is defined as rhythmic oscillatory activity within the frequency range of 8 – 12 Hz (Niedermeyer & da Silva, 2012). Alpha waves have several functional correlates reflecting sensory, motor and memory functions. You can see increased levels of alpha band power during mental and physical relaxation with eyes closed. By contrast, alpha power is reduced, or suppressed, during mental or bodily activity with eyes open. Alpha suppression constitutes a valid signature of states of mental activity and engagement, for example during focused attention towards any type of stimulus (Pfurtscheller & Aranibar, 1977). You could also say that alpha suppression indicates that your brain is gearing up to pick up information from various senses, coordinating attentional resources and focusing on what really matters in that particular moment.
Typical studies on alpha:
Meditation. As alpha reflects relaxation and sensory inhibition, meditation studies compare alpha levels of of experienced and novice meditators (for more details, see Klimecki and colleagues, 2012).
Biofeedback training. Here, alpha band power is monitored to track the relaxation level of a respondent. Increased levels of alpha power are interpreted as deeper relaxation. This is particularly useful in rehabilitation scenarios or for clinical populations, for example children suffering form ADHD.
Attention. Spatial, semantic and social attention are closely related to alpha power. Often, researchers present objects, words or more complex social stimuli on screen and monitor alpha power during the encoding phase. Poor performers and distracted respondents generally show higher amounts of alpha power (for more details, see Rana & Vaina, 2014).
4. Beta band (12- 25 Hz)
Oscillations within the 12 – 25 Hz range are commonly referred to as beta band activity (Niedermeyer & da Silva, 2012). This frequency is generated both in posterior and frontal regions. Active, busy or anxious thinking and active concentration are generally known to correlate with higher beta power. Over central cortex (along the motor strip), beta power becomes stronger as we plan or execute movements, particularly when reaching or grasping requires fine finger movements and focused attention. Interestingly, this increase in beta power is also noticeable as we observe others’ bodily movements. Our brain seemingly mimics the limb movements of others, indicating that there is an intricate “mirror neuron system” in our brain which is coordinated by beta frequencies (Zhang et al., 2008).
Typical studies on beta:
Motor control. Studies on motor control usually require the respondent to reach towards or grasp objects that are either physically present or simulated on screen or in virtual reality. Haptic feedback is often provided via haptic robots attached to the fingers or limbs, mimicking the physical characteristics of the target objects. Also, clinical populations such as patients suffering from Parkinson’s, Multiple Sclerosis (MS) or other neurodegenerative disorders are compared to age-matched healthy controls (for example, see Lainscsek et al., 2013).
Stimulant-induced alertness. Beta frequencies are often monitored during stimulation with extreme light / sound stimuli and psychostimulants modifying levels of alertness and attentional processing.
5. Gamma band (above 25 Hz)
At the moment, gamma frequencies are the black holes of EEG research as it is still unclear where exactly in the brain gamma frequencies are generated and what these oscillations reflect. Some researchers argue that gamma, similar to theta, serves as a carrier frequency for binding various sensory impressions of an object together to a coherent form, therefore reflecting an attentional process. Others argue that gamma frequency is a by-product of other neural processes such as eye-movements and micro-saccades, and therefore do not reflect cognitive processing at all. Future research will have to address the role of gamma in more detail.
Typical studies on gamma:
Microsaccade studies. Here, high-speed research eye tracking is combined with high-speed EEG to analyze how subtle eye movements affect EEG gamma frequencies. Stimuli are mostly screen-based, with fixation targets appearing on different screen positions (for more details see Dimigen et al., 2009).
Collecting clean EEG data
“There is no substitute for clean data“ – wise words of Professor Steve Luck from UC Irvine that you should keep in mind whenever you collect EEG data. To this day, there is no algorithm that is able to decontaminate poorly recorded data. You simply cannot clean up or process data in a way that magically improves the signal.
The basic principle of “GIGO – garbage in, garbage out” also applies to EEG data Therefore, always start with properly recorded data. Recording clean data has a couple of perks:
- Run more experiments per year.
Don’t waste your time trying to make the best out of badly recorded data. Collect clean data right from the outset. - Publish more and better papers.
Clean data implies that your hypotheses can be tested much better. If you only have bad data, how can you be sure that an effect is due to differences in cognitive states, and not just a side-effect of some artifact? Reviewers will honor your efforts in boosting data quality. - Increase likelihood of better funding and job offers.
Presenting clean data in a grant application significantly boosts your funding chances. Also, presenting results based on clean data at a conference or at the next job interview will show your research skills in their best light.
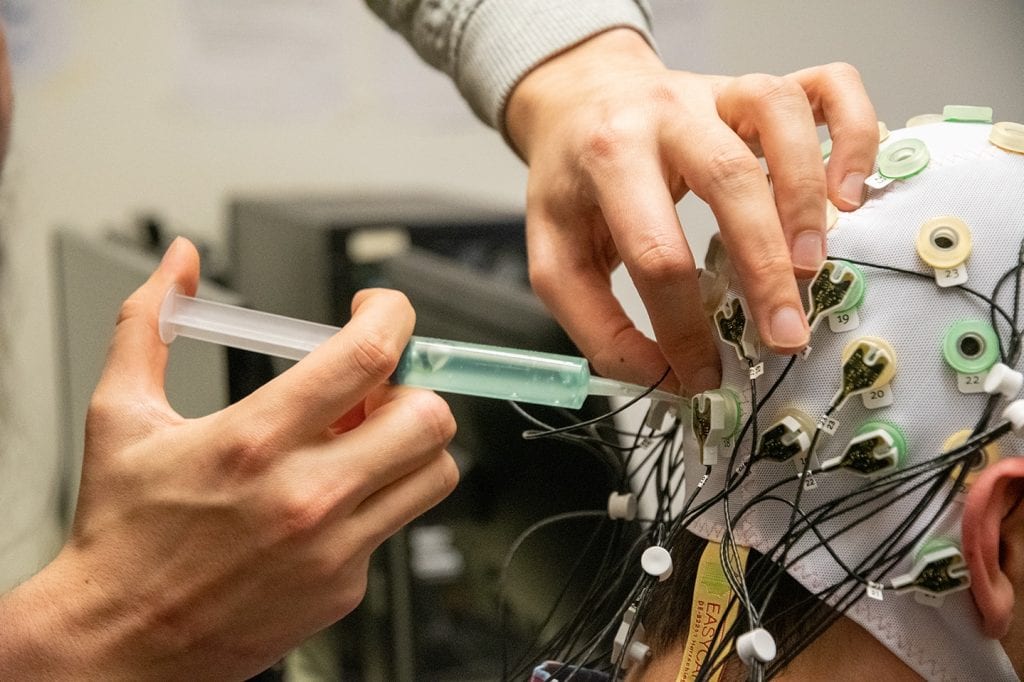
EEG Electrodes
EEG systems use electrodes attached to the scalp to pick up electric potentials generated by the brain. Of course, you could just attach wires to the skin – however, this would create a very unstable electrical connection. Rather, opt for wet EEG electrodes. These are metal disks or pellets that connect with the skin via conductive gel, paste or cream, typically based on saline.
The right combination of electrode metal and conductive paste is important as some metals corrode rather fast, resulting in poor data.
Under optimal conditions, your skin, the electrode and the electrode gel function as capacitor and attenuate the transmission of low frequencies (slow voltage changes in the delta frequency range, for example). The most common wet electrode type is made of silver (Ag) with a thin layer of silver chloride (AgCl) – you will often find descriptions like Ag/AgCl electrodes.
Alternatively, you can use dry EEG electrodes. These make direct contact with the skin without requiring electrode gel. Typically, dry electrodes are much faster to apply, however at the same time are more prone to motion artifacts compared to wet sensors (movement of the electrode, cap or respondent; Saab et al., 2011).
Electrode arrays and placement
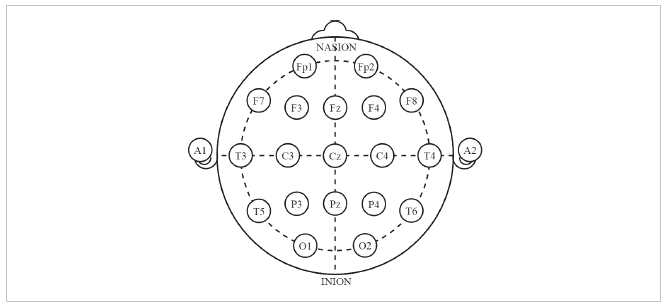
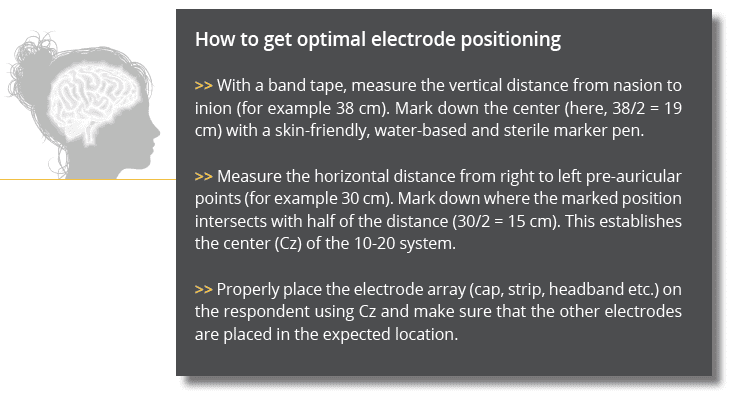
The most common systems for defining and naming electrode locations/positions along the scalp have been provided by the American Encephalographic Society (1994) as well as Oostenveld & Praamstra (2001). Typically, these are referred to as the 10-20 system and 10-5 system, respectively. In the 10-20 system, electrodes are placed at 10% and 20% points along lines of longitude and latitude.
Important points in the 10-20 system are:
- Nasion (Nz)
The depression between the eyes at the top of the nose. - Inion (Iz)
The bump at the back of the head. - Left and right preauricular points
You can feel these depressions just anterior to the ears with your fingers when you open and close your mouth.
The vertical line connecting nasion (front) and inion (back) as well as the horizontal line connecting left and right pre-auricular points are now divided into ten equal sections.
Similarly, the equator is divided into 10% and 20% portions.
The 10 – 20 system
In the 10-20 system, electrode names begin with one or two letters indicating the general brain region or lobes where the electrode is placed (Fp = fronto-polar; F = frontal; C = central; P parietal; O = occipital; T = temporal).
Each electrode name ends with a number or letter indicating the distance to the midline. Odd numbers are used in the left hemisphere, even numbers in the right hemisphere. Larger numbers indicate greater distances from the midline, while electrodes placed at the midline are labeled with a “z” for zero. For example, Cz is places over midline central brain regions, Fp8 is placed over right fronto-polar brain regions, and T7 is placed over left temporal regions.
Number and distribution of electrodes
Following the recommendations of Luck (2014) and Michel and colleagues (2004), there is no one-size-fits-all optimal number of electrodes for EEG experiments. The number and placement of electrodes might vary dependent on existing results and findings.
If nothing is known about the brain process of interest and co-registration with MRI recordings are necessary (for source reconstruction, for example), you might want to record from at least 64 channels to get a deeper understanding of where the signals originate from. However, typical surface-based EEG paradigms do well with 32 channels or less. It is recommended to start small and then expand as you gain expertise and knowledge. Remember that you will have to spend a lot more time setting up and analyzing EEG arrays with 128+ channels than a 20 channel array – which might have been sufficient for your study.
Another aspect to keep in mind is electrode distribution. Try to place electrodes evenly across the scalp (Michel et al., 2004) as you will be able to draw more representative conclusions. Imagine the following example: The literature and your previous research indicates that the strongest effects in an EEG paradigm are to be expected in left frontal regions. Yet, you shouldn’t just place a few electrodes over left frontal regions and neglect the other regions. Instead, use a reasonable number of electrodes and record from other areas as well. By doing this, you can make sure to properly separate effects from artifacts. While brain activity changes may only affect the electrodes of interest, artifacts might be visible at all electrodes, irrespective of where they have been placed.
Reference and ground electrode (and some math)
EEG recordings are obtained from several electrodes. You might think that the value at Cz reflects the electrical activity at that very location. However, there is no such thing as voltage at a single point. Instead, EEG voltage reflects the potential (or current) between the site (Cz, for example) and the ground electrode (G).
Therefore, the voltage recorded between Cz and G is simply Cz – G. Since the ground electrode is connected to the ground circuit in the amplifier, there’s always some electrical noise introduced by the ground electrode. As a result, the measured voltage between Cz and G contains brain-based activity as well as electrical noise.
To overcome this limitation, EEG systems introduce a reference electrode R. The amplifier records the potential between Cz and the ground electrode (Cz – G) as well as the potential between the reference and ground electrodes (R – G). Based on this, the amplifier now computes the difference between Cz and the reference electrode as [Cz – G] – [R – G], which is identical to Cz – G – R + G, which simplifies to Cz – R (as G cancels out). Therefore, the output of the amplifier is the electrical potential between the recording site (Cz) and the reference electrode – as if the ground electrode (G) doesn’t exist.
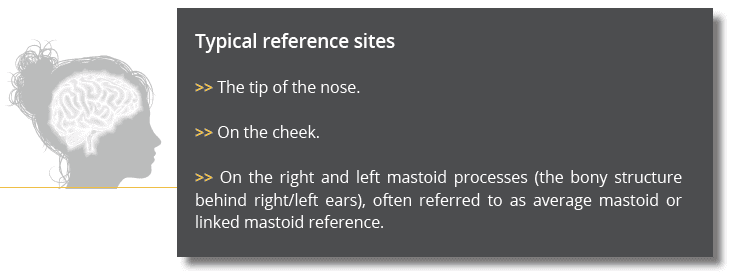
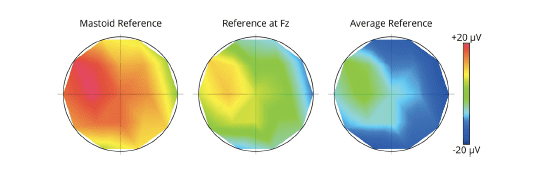
Now what is the best place for the reference electrode? In fact, there is none – the choice of the reference only affects the absolute electrode voltages across all electrodes while the relative voltages remain completely unchanged.
This means that changing the site of the reference may make the scalp voltages look quite different, even though the relative distribution is completely identical. Imagine a landscape with mountains and valleys. Changing the reference electrode is similar to flooding the landscape with water. While the sea level changes, the absolute shape of the landscape is completely unchanged. This is discussed in more detail in Michel et al. (2004).
Electrode impedance
A stable electrical connection between electrode and scalp is key to recording clean EEG signals. However, dead skin cells, oily skin secretions (sebum), and sweat accumulate on the scalp and constitute a wall of electrical resistance as they do not propagate electrical activity well. The technical expression in case of EEG recordings is impedance, which is measured in units of Ohm (Ω).
EEG systems generally offer software or hardware-based quality indicators where the impedance of each electrode is visualized graphically. Green colors and low impedance values typically imply high recording quality, while red colors and high impedance values imply low recording quality. In other words: Only when impedances are low you can be absolutely sure that the recorded signal reflects the processes inside of the head rather than artefactual processes from the surroundings. Therefore, whenever you collect EEG data, make sure that impedances are as low as possible.
Here is some advice on how you can lower impedances :
-
Instruct respondents to come to the experimental session with washed and dried hair.
No hair care products should be applied (hairspray, conditioner, wax or gel, for example), and hair should be completely dry. Also, instruct respondents to not wear any hair pins or clips as they will have to be removed anyway. Wet hair and other treatments will cause higher impedances. Also, hair pins – if undetected – might cause connections between neighboring electrodes and are hard to detect once the EEG cap / strip has been put on. Another benefit of plainly washed hair is that you can move hair much better away from the EEG sites (hair is a poor conductor).
-
Clean all electrode sites with alcohol.
You can use a 70% isopropanol, alcohol swabs, or Q-tips dipped in alcohol, for example. After putting on the EEG cap and before plugging in the electrodes, you can press an alcohol-dipped Q-tip into each of the electrode sockets and rub it gently, but with purpose between two fingers. Also apply the alcohol on other important recording sites such as the reference electrode (often behind the left/right ear) or above/below/to the side of the eyes (for electrooculogram recordings, EOG). Remember to instruct respondents to close their eyes as the evaporating alcohol can cause negative reactions to the eye. Always wait until the alcohol is completely evaporated before you proceed.
-
Apply electrode gel/conductive paste.
Some conductive pastes are abrasive and contain pumice stone particles (similar to a facial mask). In this case, you can lower impedances massively by dipping a Q-Tip or a wooden stick with a cotton swab into the paste and then applying the paste to each of the electrode sockets. Again, gently push down and rub the stick. Then, fill the socket with paste and put in the electrode. Non-abrasive gels (similar to gels used for ultrasound recordings) don’t rely on your rubbing skills. Instead, you can simply paste the gel into the socket. It is noteworthy not to overdo the gel application. If you apply too much gel, you might create gel bridges between neighboring electrodes, causing invalid and artefactual data that is hard (or impossible) to save during post-processing.
Signal digitization, amplification and forwarding
Once the voltage has been picked up by the electrodes, the continuous, analog signal has to be amplified and digitized in order to be stored on a computer. Although all of this happens under the hood and without you noticing, it’s good to know some basic facts about amplification and digitization.
As your brain is constantly active, there are continuous fluctuations and variations of the generated voltages. EEG systems, however, take discrete snapshots of this continuous process, generating samples of data – similar to pictures taken by a camera. EEG systems differ in the sampling rate (the number of samples per second) they can take.
Similar to oscillations, sampling rates are expressed in samples per second with the unit Hertz (Hz) – an EEG system with a sampling rate of 250 Hz can take 250 samples per second, for example. Since 1 second can also be expressed as 1000 ms, neighboring samples are 1000 / 250 = 4 ms apart. By contrast, if EEG is sampled at 500 Hz, samples are 1000 / 500 = 2 ms apart. If you are interested in measurements with higher time precision, you should collect EEG data at a higher sampling rate (i.e., > 500 Hz). If you are interested in frequency-based analyses (such as prefrontal lateralization of alpha or beta bands), a sampling rate of 128 Hz can be sufficient.
Additionally to the digitization, the EEG signal is amplified. That is the reason why EEG systems are so expensive.
Think of this as the sound system for your data: Like the mono speaker on your phone, poor amplification doesn’t get as much signal out compared to a high-end amplifier (like a DOLBY 3D system at the movie theater), which emphasizes even very subtle voltage changes. Some EEG systems are modular, allowing you to arbitrarily combine electrodes and different kinds of amplifiers while other EEG systems come as fixed combination of electrode grid and amplifier box.
After the signals have been digitized and amplified, they are transmitted to the recording computer. This is either achieved through a wired connection (via USB, for example) or wirelessly (e.g. via Bluetooth or WiFi connection). Wired amplifiers are still common in academic research institutions, neuroscience, and psychology labs. In contrast, commercial labs and neuromarketing agencies often use wireless EEG headsets as they allow respondents to freely move around and explore their environment without being bound to a test station at the lab.
Clean EEG data and artifacts
Before you jump into data collection and analysis, there’s one thing you should make your mantra: There is no substitute for clean data (you might remember this sentence from the beginning of this chapter). Always make sure your data is as clean as possible, meaning the collected data reflects brain activity only. Sounds simple in theory – in practice, however, there is a but. As the electrodes will pick up electrical activity from other sources in the environment, it is important to avoid, minimize or at least control these kinds of artifacts as best as possible:
Physiological artifacts
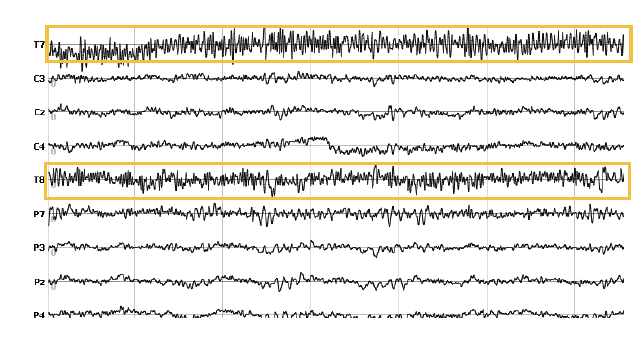
1. Muscle activity (EMG, ECG)
Muscle activity generates electric currents that are picked up by electrodes. The closer the muscles are to the electrodes, the stronger their impact on the recording will be. Particularly the activity of facial muscles (forehead, cheek, mouth), neck muscles and jaw musculature has severe effects on EEG recordings. Clenching should be avoided at all costs – instruct respondents to avoid chewing or tensing their jaw. As the heart is muscle, it also affects EEG data quality. Hearts cannot be simply instructed to stop, you have to rely on signal decontamination procedures to remove ECG noise from EEG recordings. Ideally, you can monitor heart rate with an optical sensor (e.g. photoplethysmography) or an ECG device.
2. Eye movements
Eye movements (horizontal and vertical) affect the electrical fields picked up by the electrodes. Vertical eye movements (up-down) look more sinusoidal, while horizontal eye movements (right-left) look more box-shaped. The eye has a strong electromagnetic field that is established by the millions of neurons in the retina. Moving your eyes also shifts the electrical field generated by the eye ball. It’s recommended to record eye movements using eye trackers or by placing additional EEG electrodes surrounding the eyes.
3. Blinks
Similar to eye movements, blinking interferes with brain signals quite a bit. If respondents blink while a certain stimulus is shown on screen, the EEG might not reflect the cortical processes of seeing the stimulus. As an EEG expert, you might tend to exclude this trial from the analysis since the EEG data does not contain relevant information. However, if blinking occurs non-systematically throughout the recording, attenuation based on statistical procedures such as regression and interpolation or Blind Source Separation might be more appropriate. In this case, contaminated data portions are replaced with interpolated data using surrounding data channels or time points.
External sources of artifacts
-
Movement
Movement of an electrode or headset movements can cause severe artifacts that are visible in the affected channel or in all channels. Reasons for this are manifold: The EEG headset becomes loose, an electrode loses contact with the socket. It’s always recommended to make sure that the headset sits snug on the head, and that all electrodes are securely attached to the skin.
2. Line Noise
Line noise (60 Hz in the US, 50 Hz in the EU) can have strong artifacts on the electrode recording – this becomes quite obvious in the raw EEG data. Particularly when impedances are poor, line noise is stronger. If the reference electrode is affected, the captured line noise is propagated to all other electrodes. Fortunately, the cognitive frequencies of the brain are often below the 50 or 60 Hz range, allowing you to filter your data accordingly or focus on the frequencies of interest.
3. Swaying and Swinging
Swaying and swinging can have strong effects on the recording. Especially head swinging or banging changes the water distribution, which affects the electrical properties and fields generated by the brain. Make sure respondents don‘t turn their head too fast or look up or down abruptly as this will cause shifts in the data that are hard to take care of during processing.
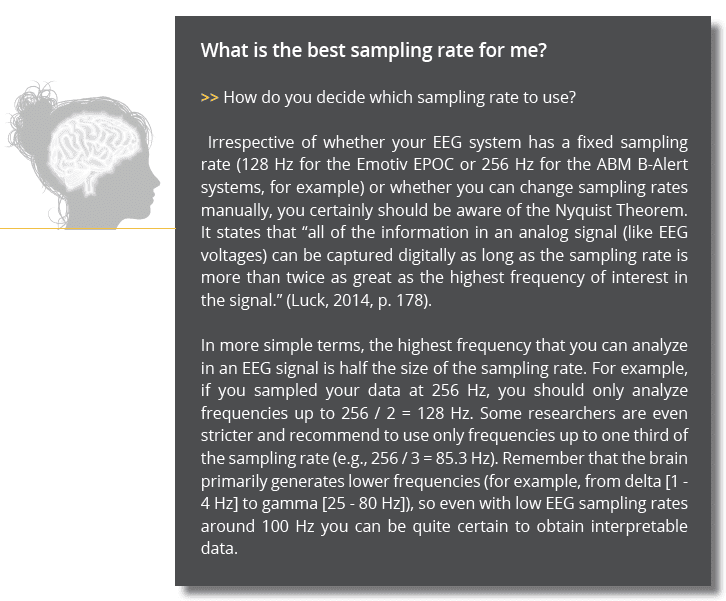
EEG Analysis: Metrics and features
When it comes to EEG analysis and feature extraction, you might easily feel overwhelmed by the huge list of pre-processing steps you have to accomplish in order to get from raw signals to results. In fact, designing smart EEG paradigms is an art – analyzing EEG data is a skill. It certainly requires a certain level of expertise and experience, particularly when it comes to signal processing, artifact detection, attenuation or feature extraction. Any of these steps require informed decisions on how to best emphasize the desired EEG processes or metrics of interest.
What is a valid signal to you might be noise to anyone else. There simply isn‘t a generic data processing pipeline that you could apply to any EEG dataset, irrespective of the characteristics of the device, the respondent population, the recording conditions, the stimuli or the overall experimental paradigm.
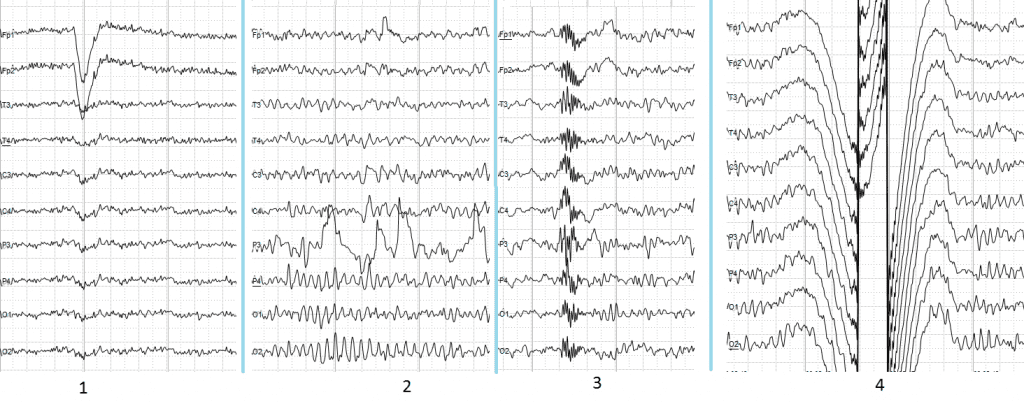
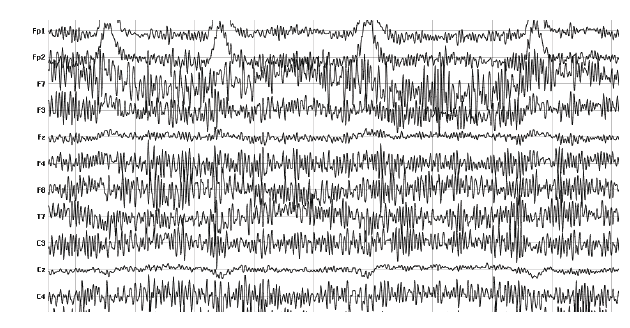
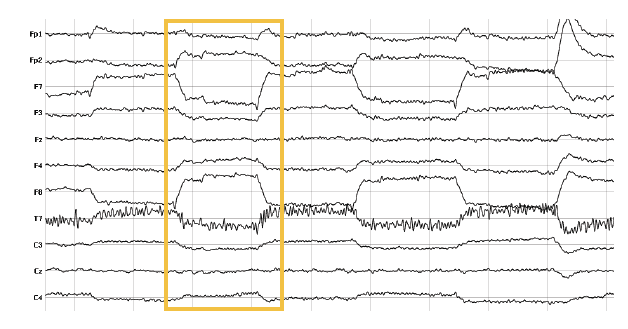
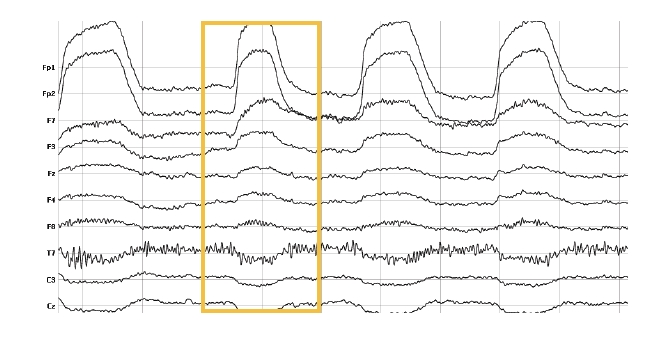
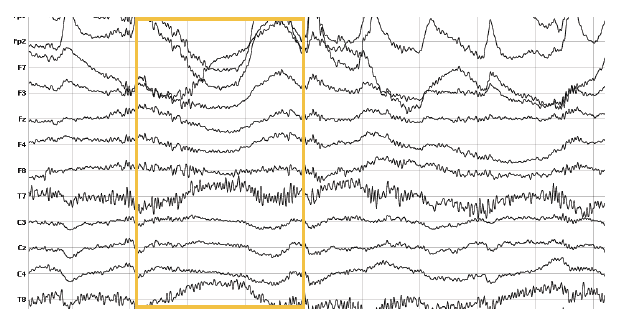
Image from Andrii Cherninskyi CC BY 3.0
1. Electrooculographic artifact caused by the excitation of eyeball’s muscles (related to blinking, for example). Big amplitude, slow, positive wave prominent in frontal electrodes.
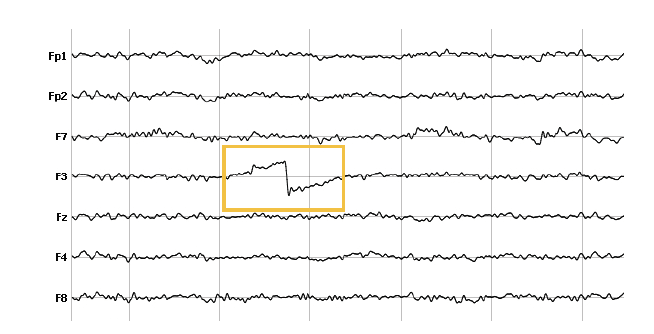
2. Electrode’s artifact caused by bad contact (and thus bigger impedance) between P3 electrode and skin.
3. Swallowing artifact.
4. Common reference electrode’s artifact caused by bad contact between reference electrode and skin. Huge wave similar in all channels.
Fortunately, some modern EEG systems come with an autopilot for data processing – they take the lead and apply automated de-noising procedures or automatically generate high-level cognitive-affective metrics which can be used in order to get to conclusions much faster.
Event-related potentials (ERPs)
The goal of event-related EEG paradigms is to collect those brain processes which are triggered by external stimuli. Event-related EEG paradigms present stimuli repeatedly – 100 times or more, for example. At the same time, stimuli are shown just very briefly for 200 to 1000 ms.
Take a look at the logic behind event-related EEG studies:
1. There is continuous and ongoing EEG activity as well as random noise completely unrelated to the onset of a stimulus continually occurring. This is your “default activity“ (your ongoing thoughts and mental states). When you present a stimulus, you trigger stimulus-related EEG activity.
2. In order to uncover the stimulus-related EEG data from the unrelated ongoing data, the stimulus is shown several times – 50 times or more, for example. At the end of the data collection, you will have 50 trials, which are data portions time- locked to stimulus-onset and typically range from about 200 ms prior to stimulus onset to 1000 ms after stimulus onset. Each trial is a time-course of data at each electrode. The selection of data portions from the continuous EEG recording is called epoching or segmentation (sometimes followed by a baseline correction of each trial where the average of the EEG data before each stimulus is subtracted from the data after the stimulus).
3. After the exclusion of epochs containing artifacts (or the correction of data due to blinking, for example), the remaining epochs are averaged sample by sample, resulting in an average time-course of EEG data. By averaging the EEG time-courses of all trials, only the stimulus-related EEG activity survives while the unrelated random background noise is attenuated (the more repetitions you complete, the cleaner the event-related EEG data will be).
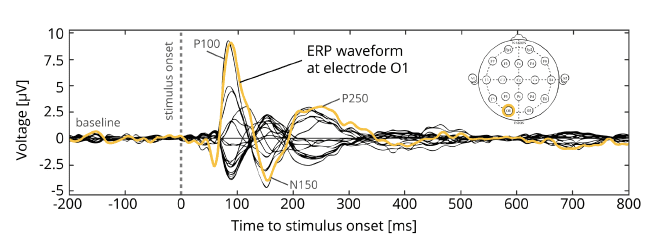
4. The remaining average EEG waveform is the event-related potential, which reflects the average stimulus-related EEG activity as triggered by a specific stimulus.
Research has identified ERPs for all sensory modalities – vision, touch and sound, olfaction and haptic stimuli. All of these sensory stimuli trigger event-related EEG activity.
ERPs can be described by several characteristics: Appearance and shape, number, latency, amplitudes of the “wiggles”, ERP components (positive and negative peaks) and topography (which is the voltage distribution at peak times across all electrodes). ERP components such as the N400, P300 or N170 represent some of the most broadly analyzed and well-understood ERP components in academic research.
You have the choice: You can plot ERPs either as time-course time-locked to stimulus onset or as sequence of voltage maps that change their distribution characteristics over time dependent on stimulus properties or different internal states. Dependent on where the voltages are strongest (positive and negative poles), you can infer which brain regions are active at a given time.
Often, scientists compare ERPs of different experimental conditions – ERPs elicited by face stimuli compared to houses, for example. Alternatively, you can compare ERPs of different respondent groups – children suffering from Autism spectrum disorder vs. age- matched controls, for example. In both situations, your analysis focuses on the differences in ERP latency, amplitude or topographic distribution at certain time-points time-locked to stimulus onset between conditions.
ERP studies require two things:
1. Stimulus repetitions
As you cannot get an ERP from a single stimulus presentation (the EEG data will contain both stimulus-related and stimulus- unrelated aspects), you need to repeat the presentation (think of 100 repetitions or more).
2. Precise stimulus timing
Event-related paradigms assume that the EEG data of each single trial is precisely time-locked to stimulus-onset. This requires that any stimulus onset markers must have been sent precisely in the moment of stimulus presentation. Whenever there is a randomly varying delay between the onset marker and the actual onset of a stimulus, the exact time-locking of the EEG data to stimulus onset cannot be guaranteed.As a result, the average ERP waveform might be washed out or vanishes completely because the single trials were not perfectly aligned to the respective stimulus onsets. The only way to be absolutely sure about the actual stimulus onset on screen, for example, is to attach a photodiode on the stimulus presentation screen and store its brightness levels with the other data. Whenever a stimulus appears on screen, the photodiode signal changes, allowing you to properly align the data to the true stimulus onset instead of a potentially incorrect onset marker.
ERP paradigms are used in the
following application fields:
General and experimental psychology use ERP’s to uncover the brain dynamics related to sensory processing, and how stimulus properties or combinations of different stimulus dimensions (eg. shape and spatial location of letters) modify brain network activity.
Clinical psychology uses ERP studies to understand how cognitive brain processes are affected by neurological or psychological diseases. In this context, patient populations are compared to age-matched controls in order to compare defective and healthy processing of sensory stimuli. One example: Face stimuli are shown to children suffering from Autism spectrum disorder and to healthy children. The differences in the ERP response between respondent groups allows insights into brain region activity affected by the disease.
Biomedical engineering uses ERP designs in the context of Brain-Computer Interfaces. One example: Patients who are partially or completely paralyzed are connected to an EEG system and exposed to rapid sequences of letters. In a training phase, their ERP activity related to relevant stimuli is extracted (oftentimes based on the P300 ERP component). Afterwards, patients are shown random letter sequences. Based on EEG data, the relevant letters can be pulled out, allowing the patients to write words and sentences simply based on their EEG activity.
You can find more details on collecting and analyzing ERP paradigms in Luck (2014).
EEG analysis: Metrics and features
ERP designs are limited to a specific set of brain activity triggered by sensory stimuli. However, the brain is a continuous oscillator and generates rhythmic activity even in the complete absence of stimuli – during sleep, for example. In order to tap into the brain activity that drives our behavior, our thoughts, motivations and emotions, a different analytic approach is required, which is based on the analysis of frequencies.
What are the major frequencies that are contributing to the brain mix? How do these frequencies vary dependent on changes in internal states or environmental factors?
You learned before that the brain generates primarily low frequencies between 1 and 80 Hz. These can be classified into specific frequency bands (such as delta, theta, alpha, beta and gamma) and associated with brain processes in specific regions underlying attention, cognition and emotion.
Compared to ERPs, frequency analyses are more closely linked to physiological processes and brain structures. This is why it’s often much easier to stick to the analysis of frequencies and frequency bands. Another benefit of frequency analyses is that much less data is required to arrive at conclusions. However, frequency-based analyses come with a cost: In contrast to ERP designs that allow insights into millisecond changes of voltages, frequency-based EEG measures have much less time precision.
Frequency-based analyses are recommended whenever testing time is limited and your analysis is not about the precise timing of stimulus-related activity but rather about the general mental, affective or cognitive state of the respondent. Frequency analyses are particularly useful in studies of cognitive-affective states – when EEG is measured while respondents attend to media content, reflect on the quality of products or food, or navigate websites or software interfaces, for example.
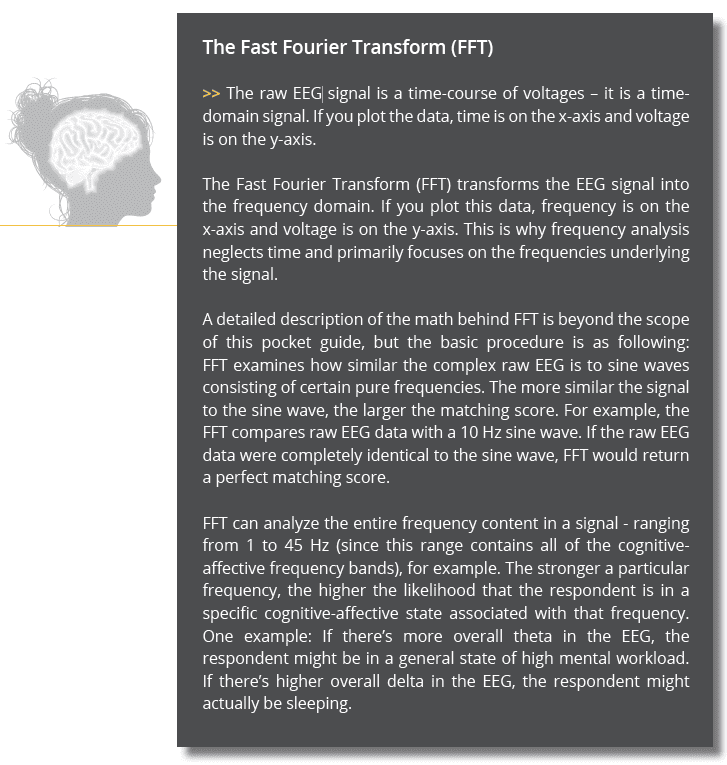
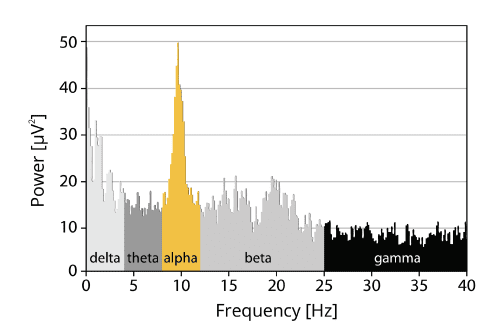
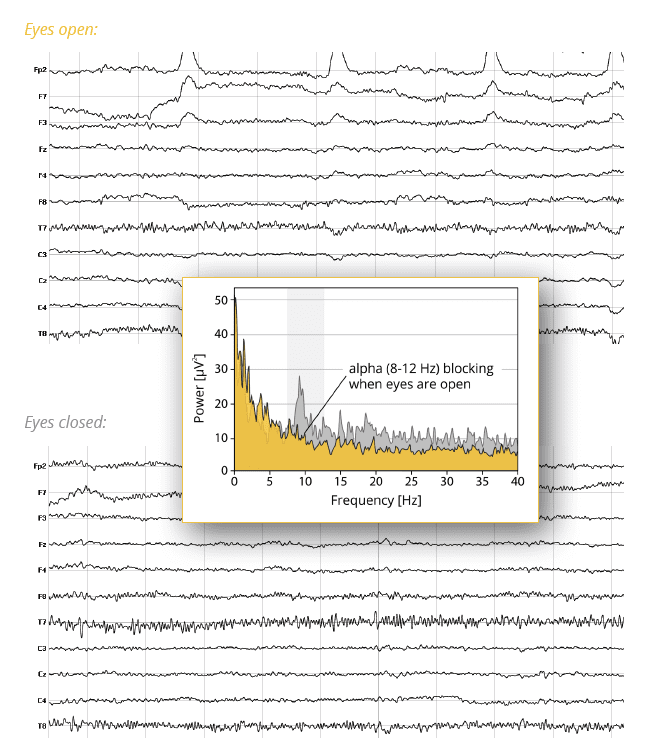
Some of the most widely used terms in frequency analysis is power, which reflects the strength of a specific frequency in the signal. Higher power means that the EEG signal contains a specific frequency to a larger extent. You could also say that the EEG signal is driven by a specific frequency. If you would like to get started with frequency-based analysis, find yourself a respondent and run one of the oldest and most replicated EEG experiments:
1. Eyes open. Record EEG data for 2 minutes from respondents and simply instruct them to keep their eyes open (they are certainly allowed to blink).
2. Eyes closed. Record EEG data for another 2 minutes and instruct respondents to close their eyes and focus on their inner thoughts and mental images.
When you analyze both conditions separately with an FFT and extract the frequencies underlying the spontaneous EEG data, you will likely notice that the condition eyes closed shows a higher frequency power in the alpha band (8 – 12 Hz) in occipital channels compared to the condition eyes open. This effect of reduced alpha power when opening the eyes is called alpha blocking and has been initially described by Hans Berger in 1929.
Frontal asymmetry
Over the last decades, frequency-based analyses of EEG data have become much more sophisticated. One of the more advanced frequency-based metrics is frontal asymmetry, or frontal lateralization.
This index of engagement and motivation typically uses beta (12 – 25 Hz) or gamma (> 25 Hz) band power, particularly in electrodes over frontal cortical regions (channels F3 and F4, for example). Researchers have consistently found that higher band power in left vs. right frontal cortex indicates positive feelings, engagement and motivation (see Davidson, 2004; Schaffer et al., 1983). Recent evidence suggest that frontal lateralization can indeed be used for testing of respondents’ engagement when confronted with media ads, physical products and services (Astolfi et al., 2008; Vecchiato et al., 2012; Yilmaz et al., 2014).
Based on research on EEG biomarkers of stable personality traits for curiosity and excitement for novel stimuli, frontal lateralization reflects a person’s momentary “approach-avoidance” tendencies to either engage or withdraw. Indirectly, this momentary engagement also reflects one’s motivation (Harmon-Jones et al., 2010). Additionally, larger left-frontal band power may serve as an index of engagement-related emotions such as joy, while larger right-frontal band power might indicate negative emotional states (disgust, fear or sadness, for example).
You might have collected EEG data from respondents watching TV advertisements, and you would like to know which ads and which scenes drive the engagement levels of your target audience and which ones should be revised before market launch. In this case, frontal asymmetry can be computed quite easily from the continuous EEG data. The two electrodes that you need are F3 and F4. Almost all EEG headsets comprise these standard locations. If your EEG system doesn’t have electrodes F3 and F4, you can also use electrodes in the vicinity of the original F3-F4 locations.
Follow these processing steps:
1. Pre-process the data
Procedures vary from study to study, so general recommendations cannot be given. Excellent starting points for finding an optimal sequence of steps are the original pvapers on frontal asymmetry as well as the books of Luck (2014) and Cohen (2014).
2. Epoch the data
In this step, the continuous EEG data during each of the advertisements is broken into smaller parts. Scientific studies recommend overlapping epochs with durations of up to 2 seconds. If you test an advertisement of 60 seconds
3. Frequency Transformation
Apply the frequency transformation to each epoch to determine which frequencies underlie the data. You can focus on the power in the beta band (12 – 25 Hz).
4. Compute the frontal asymmetry for each epoch:

In other words, the power difference between left and right hemispheres is divided by the total power of both hemispheres. Higher asymmetry reflects approach behavior while lower asymmetry reflects avoidance.
5. Plot the frontal asymmetry
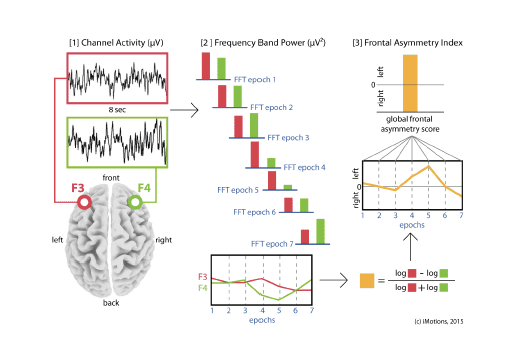
The procedure generates one asymmetry score per epoch. You can now plot the time-course of the scores to visualize the change in motivation/engagement over the course of the stimulus. Additionally, you can average values across all epochs to get a global frontal asymmetry index.
Taken together, frontal asymmetries of beta and gamma frequency bands can be interpreted with respect to the amount of motivation towards (approach) or away from (avoidance) a stimulus or mental image. Frontal asymmetry can be extracted from EEG headsets with electrodes located at frontal scalp regions (ideally, F3 and F4), allowing you to analyze short-term changes in motivation over the course of a stimulus presentation.
Cognitive-affective metrics
In addition to frequency-based brain signals associated with engagement and motivation, academic and commercial research investigate cortical processes underlying mental workload or drowsiness.
The ability to continuously monitor respondents’ levels of fatigue, attention, task engagement and mental workload in operational environments is particularly useful in scenarios where certain behaviors could potentially result in hazardous situations. One example: Monitoring cognitive workload, drowsiness and task engagement in power plant controllers could be helpful to analyze how the brain responds to generally very monotonous environments (if everything goes well), and how cortical workload and engagement scores adapt to rare but occasional disasters or life-threatening situations. This information can be used to optimize devices, software interfaces or entire work environments that increase engagement, motivation and productivity.
Besides, the continuous extraction of psychophysiological markers of engagement and vigilance from ongoing brain activity allows the design of closed-loop systems, which provide feedback on cognitive, affective and attentional states. In other words: Whenever brain-based workload or drowsiness levels exceed a specified threshold value (or engagement levels fall below a certain value), respondents can be notified to initiate counteraction. This strand of research will continue to grow in the next couple of years, designing entirely adaptive systems which respond fully automatically to brain-based user states.
The B-Alert EEG series from Advanced Brain Monitoring (ABM), for example, offers two cognitive-affective metrics, which have been validated in several academic research projects (Berka et al., 2004 / 2007; Johnson et al., 2011; Stevens et al., 2007; Stikic et al., 2014):
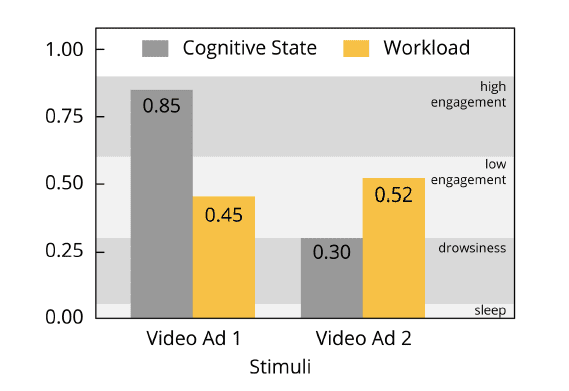
1.Cognitive States
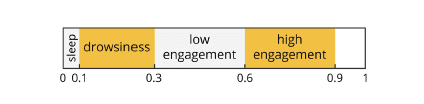
Cognitive States reflect the overall level of engagement, attention and focus during information-gathering and visual scanning. Engagement level are projected to a continuous scale with the extreme poles with values zero (low engagement) and one (high engagement). In order to classify the values in between these extremes, ABM provides the following four classification levels of increasing engagement:
• Sleep onset [0.1]
• Distraction [0.3]
• High engagement [0.9]
• Low engagement [0.6]
2. Workload
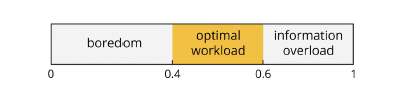
Workload reflects any cognitive process involving executive processes such as working memory, problem solving and analytical reasoning. Workload as associated with theta band activity increases with higher levels of task demands and working memory load, for example when memorizing lists or trying to block distracting stimuli in order to focus on task-related elements. Again, the numeric range for workload is from zero to one, with larger values representing increased workload. In contrast to the cognitive state metric, workload has a sweet spot in the center of the scale:
• Boredom [up to 0.4]
• Optimal workload [0.4 – 0.7]
• Stress and information overload [above 0.7]
The primary benefit of these metrics – similar to the prefrontal asymmetry index – is their standardized value range between values of zero and one. Smaller values represent less or reduced engagement or workload, while larger values reflect increased or heightened engagement or workload.
Since the metrics are computed on a second-by-second basis, you can easily evaluate how cognitive affective states change during the entire time course of dynamic stimulus presentations (navigation of a website or software, watching of a video or exploration of a shopping mall). Also, you can compute summary scores by simply averaging across longer time spans, for example across a video scene, a website, or a store section, in order to extract the general level of workload or engagement.
Another family of EEG headsets that also deliver cognitive-affective metrics are produced by Emotiv – the Emotive EPOC and EPOC+. These devices allow you to collect the following metrics:
1. Engagement/Boredom reflects long-term alertness and the conscious direction of attention towards task-relevant stimuli.
2. Excitement (Arousal) reflects the instantaneous physiological arousal towards stimuli associated with positive valence.
3. Stress (Frustration)
4. Meditation (Relaxation)
Since Emotiv doesn’t provide openly accessible publications on the validity of these scales, the scientific value of the metrics is under debate (e.g., Pham & Tran, 2012).
Frequency-based EEG metrics are used in the following commercial and academic application fields:
- Biomedical engineering
Frequency-based designs are used in the context of Brain-Computer Interfaces. By monitoring alpha activity over motor regions, researchers can detect if respondents plan to move certain limbs. Importantly, these areas continue to oscillate with a specific frequency even if the limbs are paralyzed (after an accident, for example). These brain signals can then be monitored in order to allow patients to steer robotic arms or legs based on their brain activity. - Consumer neuroscience
Frequency-based EEG metrics can be assessed from respondents exploring real or virtual stores in order to investigate engagement, motivation or drowsiness scores during the shopping trip. Where in the store are engagement levels high, where is motivation lowest? While self reports and interviews are typically biased due to limitations in respondents’ memory or elaborative skills (or due to social expectancy), EEG allows for direct and non-intrusive monitoring during the actual exploration. - Marketing research
Frequency-based EEG metrics are widely used in commercial research on brand effectiveness in product packaging and design, including websites and software interfaces in order to identify roadblocks and improve workflows based on cognitive-affective processes. - Advertisement, trailer and media testing
TV ads are supposed to make potential shoppers buy the product or service. Monitoring EEG activity of respondents watching advertisements or trailers and analyzing the data based on their frequency content can give unfiltered, unbiased insights into cognitive-affective states of the audience. Similarly, online class material and tutorial videos can be assessed with respect to engagement and workload metrics, allowing you to discard material that is hard to follow.
The end?
Not at all, if you have found this guide interesting we bet you will love our full 64-page EEG pocket guide you can download below. Have any questions for us? Feel free to contact our team of EEG experts to take your research to the next level.
Free 59-page EEG Guide
For Beginners and Intermediates
- Get a thorough understanding of the essentials
- Valuable EEG research insight
- Learn how to take your research to the next level
EEG hardware manufacturers
- Advanced Brain Monitoring (ABM) (2237 Faraday Ave, Carlsbad, CA, 92008, USA)
- ant Neuro (Colosseum 22, 7521 PT Ensched, Netherlands)
- Biosemi B.V. (WG-Plein 129, 1054SC Amsterdam, Netherlands)
- BrainMaster Technologies Inc. (195 Willis Street, Bedford, OH 44146, USA)
- Brain Products GmbH. (Zeppelinstr. 7, 82205 Gilching, Germany)
- Cognionics Inc. (8445 Camino Santa Fe [Suite 205], San Diego, CA 92121, USA)
- Electrical Geodesics (EGI). (500 East 4th Ave., Suite 200, Eugene, OR 97401, USA)
- Emotiv Inc. (268 Bush Street [Suite 4109], San Francisco, CA 94104, USA)
- g.tec Medical Engineering GmbH. (Sierningstrasse 14, 4521 Schiedlberg, Austria)
- NeuroSky Inc. (125 S Market Street [Suite 900], San Jose, CA 95113, USA)
- Mind Media BV. (Louis Eijssenweg 2B, 6049CD Herten, Netherlands)
- Mitsar Co. Ltd. (Mitsar Co. Ltd. Optikov str. 4-2A BC “LAHTA” 197374 St. Petersburg Russia)
- Neuroelectrics. (Avinguda Tibidado, 47 bis, 08035 Barcelona, Spain)
- Wearable Sensing Inc. (5754 Pacific Center Blvd, San Diego, CA 92121, USA)
EEG analysis software
- BESA Research (BESA GmbH)
- BIOPAC ACQKnowledge (BIOPAC Inc.)
- Brainstorm (University of Southern California, Los Angeles, CA)
- BrainVision Analyzer (Brain Products GmbH)
- BrainVoyager (Brain Innovation B.V.)
- Cartool Software (Biomedical Imaging Center Lausanne-Geneve)
- Curry 7 (Compumedics Limited)
- EEGLAB (Swartz Center for Computational Neurocience, UCSD)
- LORETA (KEY Institute for Brain-Min Research, Zurich)
References
- American Electroencephalographic Society (1994). American Electro-encephalographic Society. Guideline thirteen: Guidelines for standard electrode position nomenclature. Journal of Clinical Neurophysiology, 11, 111–113.
- Astolfi, De Vico Fallani, Cincotti, et al. (2008). Neural basis for brain responses to TV commercials: a high-resolution EEG study. IEEE Transactions in Neural Systems and Rehabilitation Engineering, 16(6), 522–531.
- Badcock, Preece, de Wit et al. (2015). Validation of the Emotiv EPOC EEG system for research quality auditory event-related potentials in children. PeerJ, 3, e907.
- Berka, Izzetoglu, Bunce et al. (2004). Real-time analysis of EEG indexes of alertness, cognition, and memory acquired with a wireless EEG headset. International Journal of Human-Computer Interaction, 17(2), 211–227.
- Berka, Levendowski, Lumicao et al. (2007). EEG correlates of task engagement and mental workload in vigilance, learning, and memory tasks. Aviation, Space, and Environmental Medicine, 78(5), B231–B244.
- Buzsáki, Anastassiou, & Koch (2012). The origin of extracellular fields and currents – EEG, ECoG, LFP and spikes. Nature Reviews Neuroscience, 13(6), 407–20.
- Cohen (2011). It’s about time. Frontiers in Human Neuroscience, 5(2), 1–15.
- Cohen (2014). Analyzing neural time series data. Theory and practice. Cambridge, MA: MIT Press.
- Colrain, Turlington, & Baker (2009). Impact of alcoholism on sleep architecture and EEG power spectra in men and women. Sleep, 32(10), 1341-352.
- Davidson (2004). What does the prefrontal cortex “do” in affect: Perspectives on frontal EEG asymmetry research. Biological Psychology, 67(1-2), 219–234.
- de Vico Fallani., Astolfi, Cincotti et al. (2008). Structure of the cortical networks during successful memory encoding in TV commercials. Clinical Neurophysiology, 119(10), 2231–223764
- Dimigen, Valsecchi, Sommer, & Kliegl (2009). Human microsaccade-related visual brain responses. The Journal of Neuroscience, 29(39), 12321–31.
- Gratton, Coles, & Donchin (1983). A new method for off-line removal of ocular artifact. Electroencephalography and Clinical Neurophysiology, 55(4), 468–484.
- Handy (2005). Event-related potentials: A methods handbook. Cambridge: MIT Press.
- Harmon-Jones, Gable, & Peterson (2010). The role of asymmetric frontal cortical activity in emotion -related phenomena: A review and update. Biological Psychiatry, 84, 451–462.
- Johnson, Popovic, Olmstead et al. (2011). Drowsiness/alertness algorithm development and validation using synchronized EEG and cognitive performance to individualize a generalized model. Biological Psychology, 87(2), 241–250.
- Jung, & Berger (1979). Fünfzig Jahre EEG. Hans Bergers Entdeckung des Elektroenkephalogramms und seine ersten Befunde 1924–1931. Archiv für Psychiatrie und Nervenkrankheiten, 227, 279–300.
- Kahana, Sekuler, Caplan, Kirschen, & Madsen (1999). Human theta oscillations exhibit task dependence during virtual maze navigation. Nature, 399(6738), 781-784.
- Klimecki, Leiberg, Lamm, & Singer (2012). Functional neural plasticity and associated changes in positive affect after compassion training. Cerebral Cortex, 23(7), 1552-1561.
- Klimesch (1996). Memory processes, brain oscillations and EEG synchronization. International Journal of Psychophysiology, 24(1-2), 61-100.
- Lainscsek, Hernandez, Weyhenmeyer, Sejnowski, & Poizner (2013). Non-linear dynamical analysis of EEG time series distinguishes patients with Parkinson’s disease from healthy individuals. Frontiers in Neurology, 04-200.
- Lopes da Silva, Gonçalves, & de Munck (2009). Electroencephalography (EEG). Encyclopedia of Neuroscience, 849-855.65
- Luck (2005). Ten Simple Rules for Designing ERP Experiments. In Handy. Event-Related Potentials: A Methods Handbook. Cambridge, MA: MIT Press.
- Luck (2014, 2nd edition). An introduction to the event-related potential technique. Cambridge, MA: MIT Press.
- Mizuhara, Wang, Kobayashi, & Yamaguchi (2004). A long-range cortical network emerging with theta oscillation in a mental task. Neuroreport, 15(8), 1233.
- Niedermeyer & Lopes da Silva (2012, 6th edition). Electroencephalography: Basic Principles, Clinical Applications, and Related Fields. Philadelphia, PA: Lippincott Williams & Wilkins.
- Ohme, Reykowska, Wiener, & Choromanska (2010). Application of frontal EEG asymmetry to advertising research. Journal of Economic Psychology, 31(5), 785–793.
- O‘Keefe, & Burgess (1999). Theta activity, virtual navigation and the human hippocampus. Trends in Cognitive Sciences, 3(11), 403-406.
- Onton, Delorme, & Makeig (2005). Frontal midline EEG dynamics during working memory. Neuroimage, 27(2), 341-356.
- Oostenveld, & Praamstra (2001). The five percent electrode system for high-resolution EEG and ERP measurements. Clinical Neurophysiology, 112(4), 713–719.
- Pham, & Tran (2012). Emotion recognition using the Emotiv EPOC device. In Lecture Notes in Computer Science, 7667, 394–399.
- Ramsøy (2015). Introduction to Neuromarketing & Consumer Neuroscience. Rørvig: Neurons Inc ApS.
- Rana, & Kaina (2014). Functional roles of 10 Hz alpha-band power modulating engagement and disengagement of cortical networks in a complex visual motion task. PLOS One, 9(10), e107715.
- Saab, Battes, & Grosse-Wentrup (2011). Simultaneous EEG recordings with dry and wet electrodes in motor-imagery. 5th International Brain-Computer Interface Conference (BCI 2011), 312–315.66
- Schack, Klimesch, & Sauseng (2005). Phase synchronization be-tween theta and upper alpha oscillations in a working memory task. Inter-national Journal of Psychophysiology, 57(2), 105-114.
- Schaffer, Davidson, & Saron (1983). Frontal and parietal electroencephalogram asymmetry in depressed and nondepressed subjects. Biological Psychiatry, 18, 753–762.
- Stevens, Galloway, & Berka (2007). EEG-related changes in cognitive workload, engagement and distraction as students acquire problem solving skills. 11th International Conference on User Modeling (UM 2007), 187–196.
- Stikic, Johnson, Tan, & Berka (2014). EEG-based classification of positive and negative affective states. Brain-Computer Interfaces, 1(2), 99–112.
- Vecchiato, Toppi, & Astolfi (2012). The added value of the electrical neuroimaging